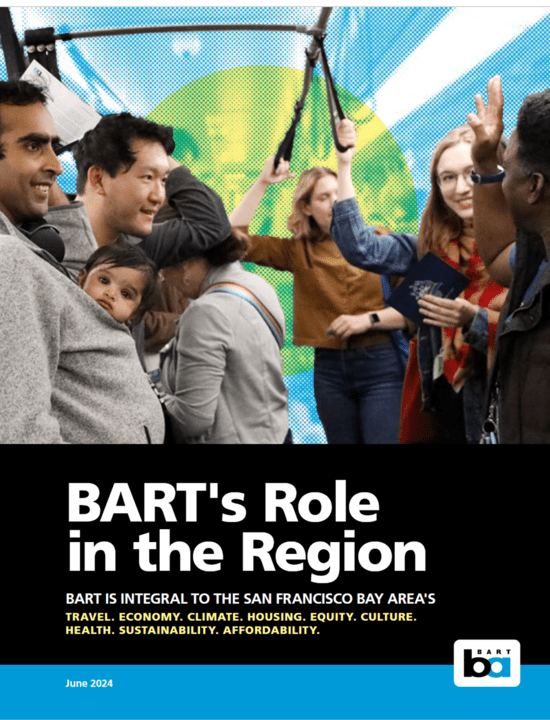
BART’s “Role in the Region” detailed in new report that describes the benefits of BART and the devastating impacts of a Bay Area without it
A new report released today paints a bleak picture of a Bay Area without BART while highlighting the benefits of the transit system to the region with a wide range of metrics.
Click here to view a pdf of the report and visit the project webpage at bart.gov/roleintheregion.
BART's Role in the Region Report aims to inform a regional conversation about the future of BART by describing its contributions to the Bay Area. It also provides predictions for how the Bay Area – its economic viability, traffic-choked roadways, cultural institutions, and more – will look without BART.
“The Bay Area and our regional transportation network have undergone significant changes since BART last conducted a Role in the Region study in 2016," said BART General Manager Bob Powers. “The 2024 Role in the Region Report arrives at a crucial crossroads for BART and the region, and the data, analyses, and stories within will serve as an important educational resource for the pivotal years ahead.”
In the report, you will find insights into key topics, including changes in travel patterns and funding; BART’s holistic benefits to the Bay Area; and BART’s future.
Below is a snapshot of some of the report’s findings:
BART’s benefits:
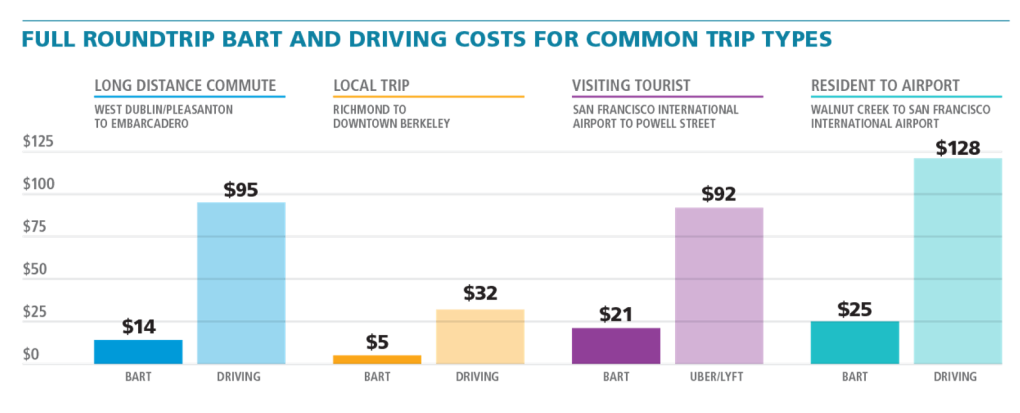
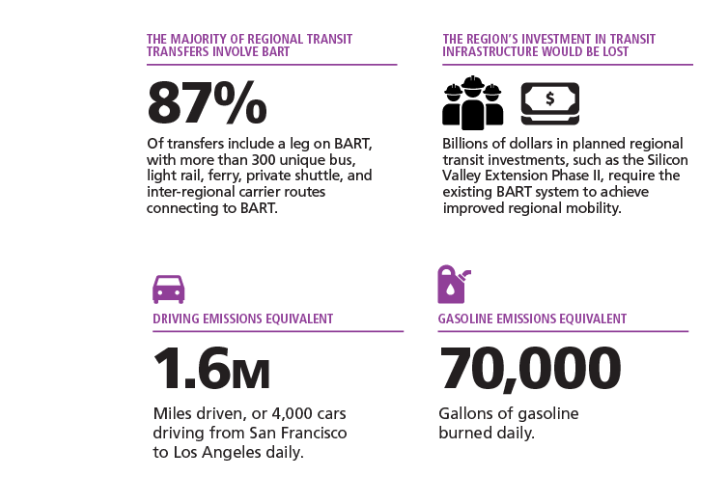
- BART is significantly more affordable than driving (Fig. 1 in slideshow). Example: Taking BART from West Dublin/Pleasanton Station to Embarcadero Station roundtrip costs $14. Driving the same route costs $95 when accounting for gas, tolls, parking, insurance, and maintenance.
- BART is integral to a connected regional transit network. Within a 15-minute walk of BART and one transfer to a connecting agency transit stop, you can reach 67% of the 9-county Bay Area region’s jobs, 61% of the region’s residents, and 60% of schools, parks, and libraries.
- In 2023, BART contributed $1.2 billion to the economy through more than 5,000 jobs when accounting for BART’s direct payroll expenditures, local vendor spending, and employee expenditures. Between 2019 and 2023, BART infused the local economy with more than $3.7 billion in construction spending and $1.7 billion in construction labor income.
If BART did not exist:
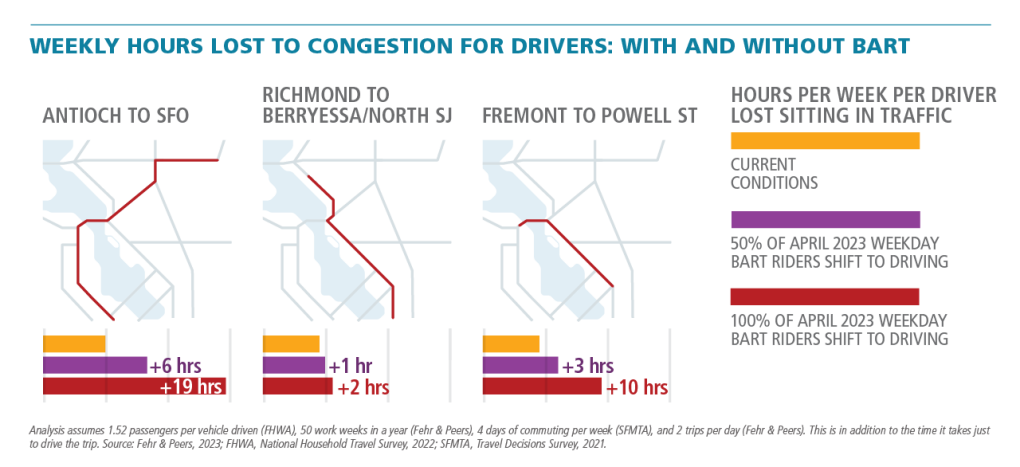
- Regional traffic congestion would worsen. Example: Drivers could experience up to an additional 19 hours lost to congestion weekly (Fig. 2).
- Traffic could increase by 73% on the Bay Bridge and 22% in the Caldecott Tunnel during morning peak commute hours.
- The regional transit network would fail to function, and there would be cascading effects across the 300 bus, light rail, ferry, private shuttle, and inter-regional routes that connect to BART (Fig. 3).
Changing regional travel trends:
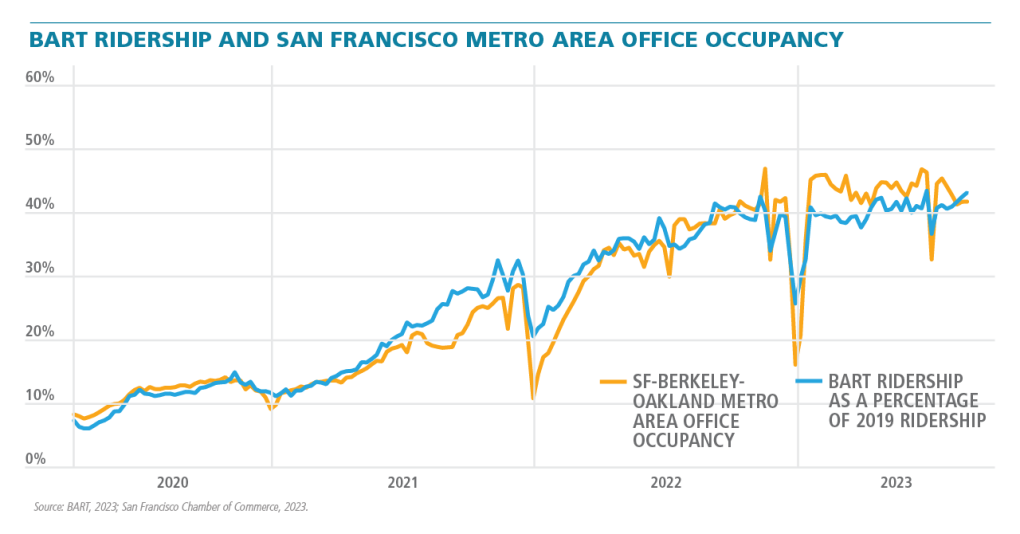
- BART ridership is closely linked to regional office occupancy rates; both have recovered to ~43% of pre-pandemic levels (Fig. 4).
- Because of BART’s decreased farebox recovery, BART expects a budget deficit beginning in 2026 when state and federal emergency assistance runs out.
View the full Role in the Region Report.